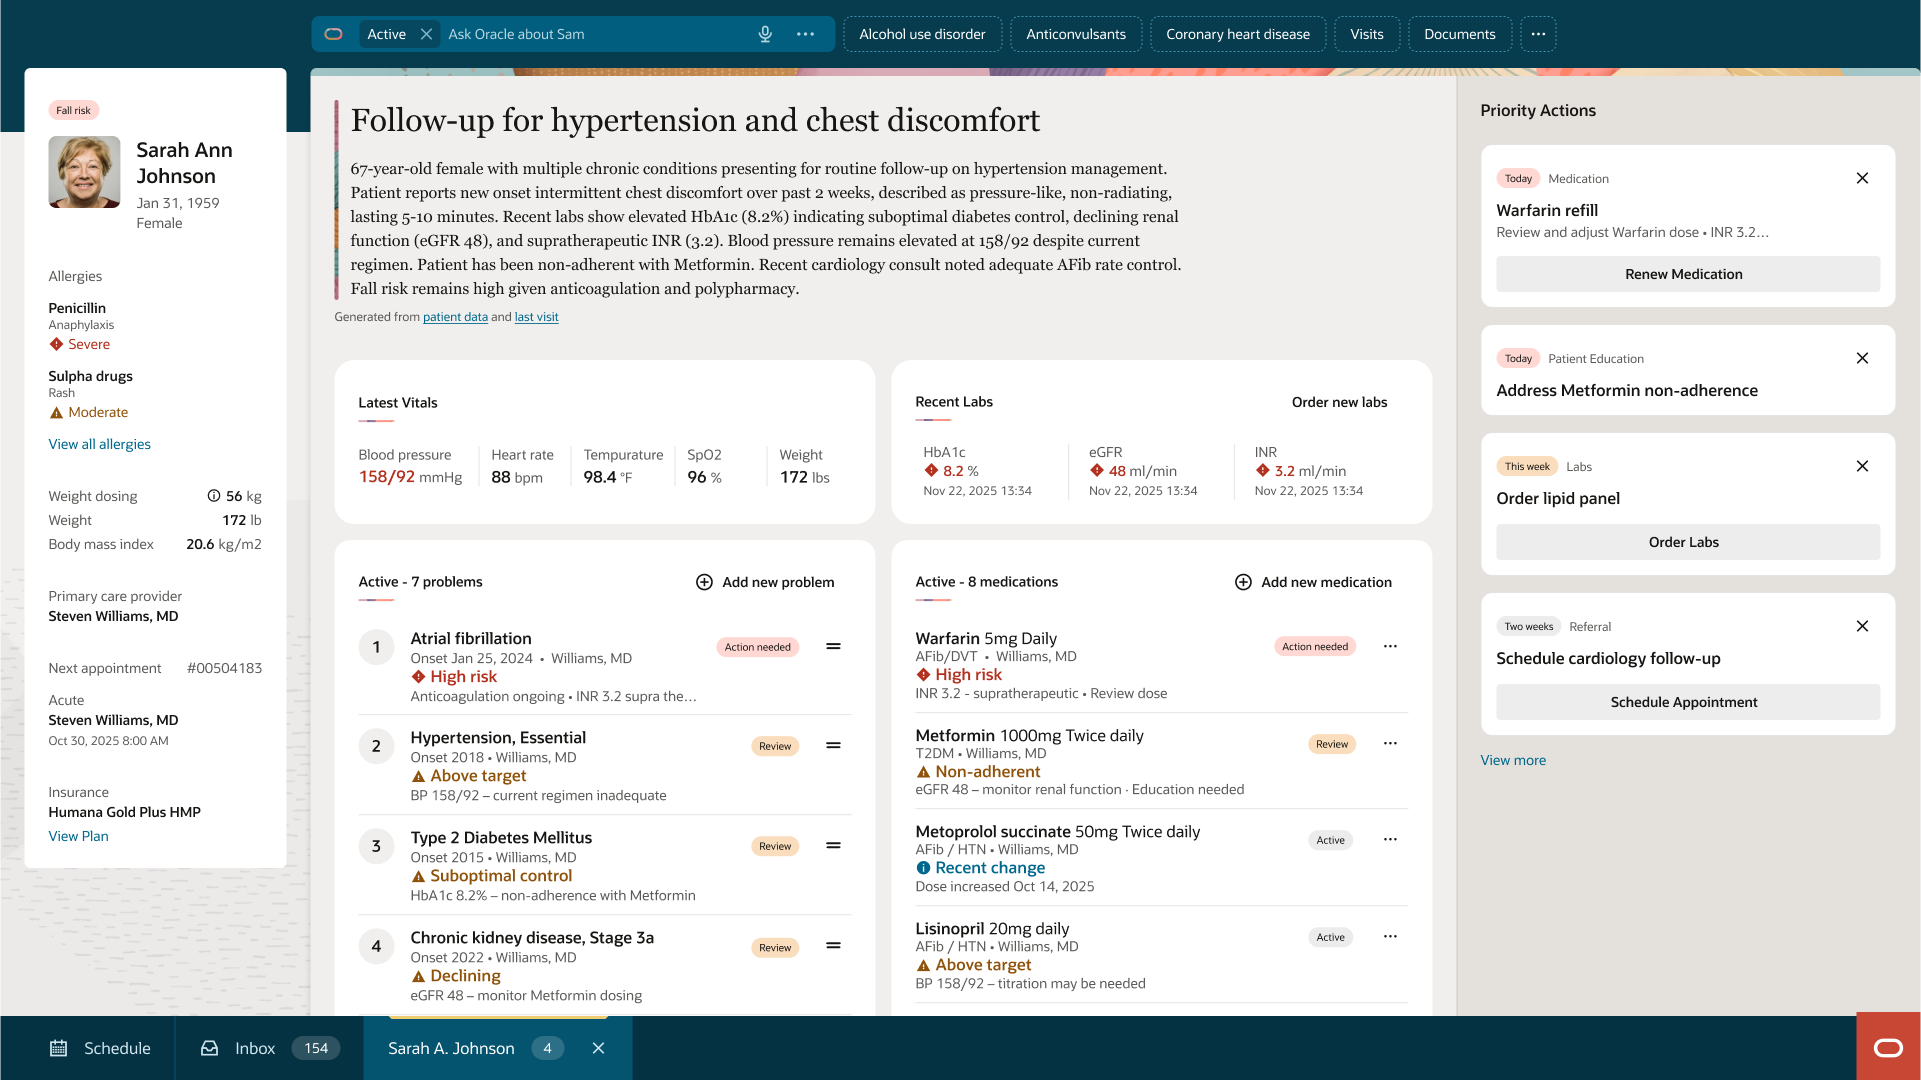
Building one consistent way to show patient data across the Oracle Health EHR, from overview pages to detailed records, for every clinical role and care setting.
Building the patient chart required moving fast: experiment, implement, validate, iterate.
Oracle Health needed to build a dedicated system, purpose-built for clinical workflows.
The intent was to build a clinical products need now, fold back into Redwood later.
I owned lists, cards, and tables, the primary data surface in every clinical workflow.
Collaborated across other principal designers and design directors to ensure system-wide consistency.
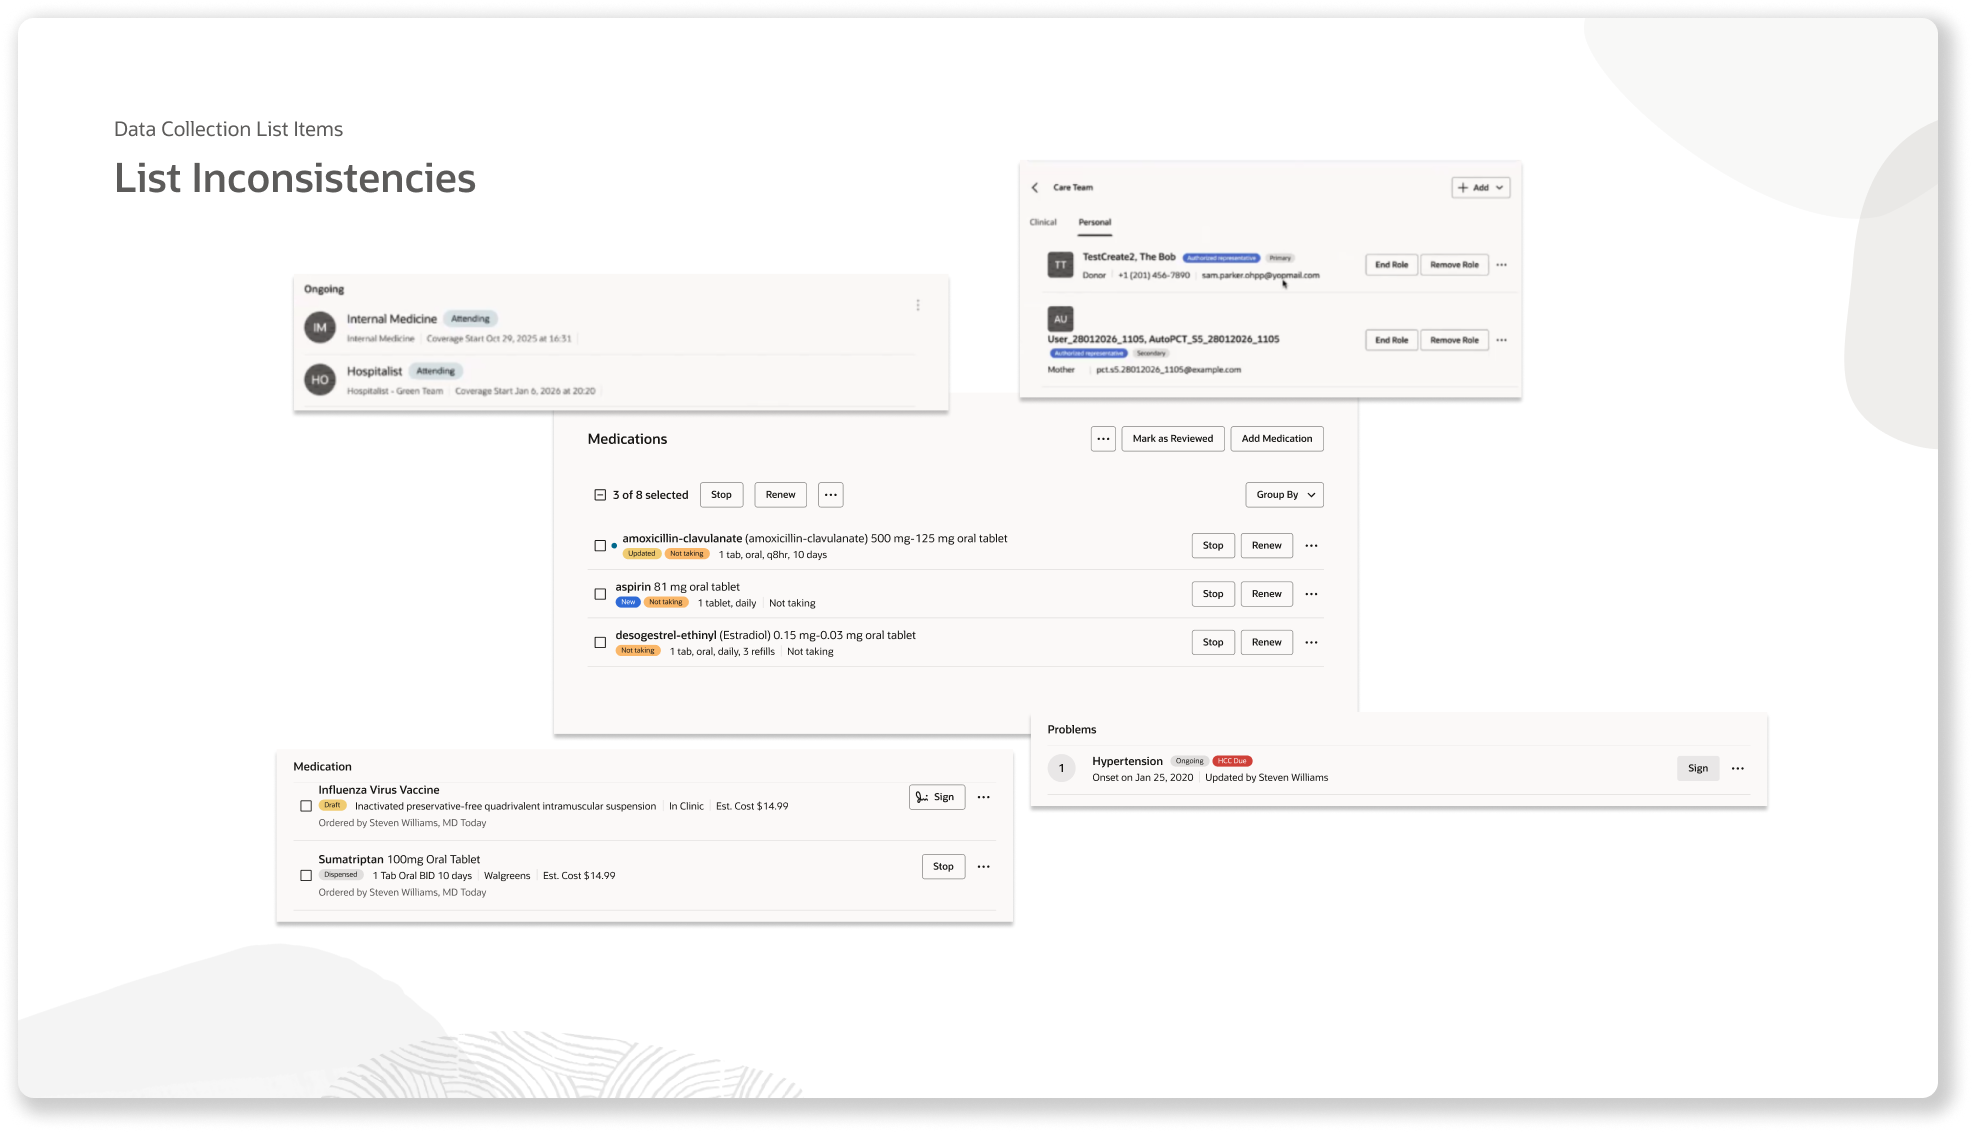
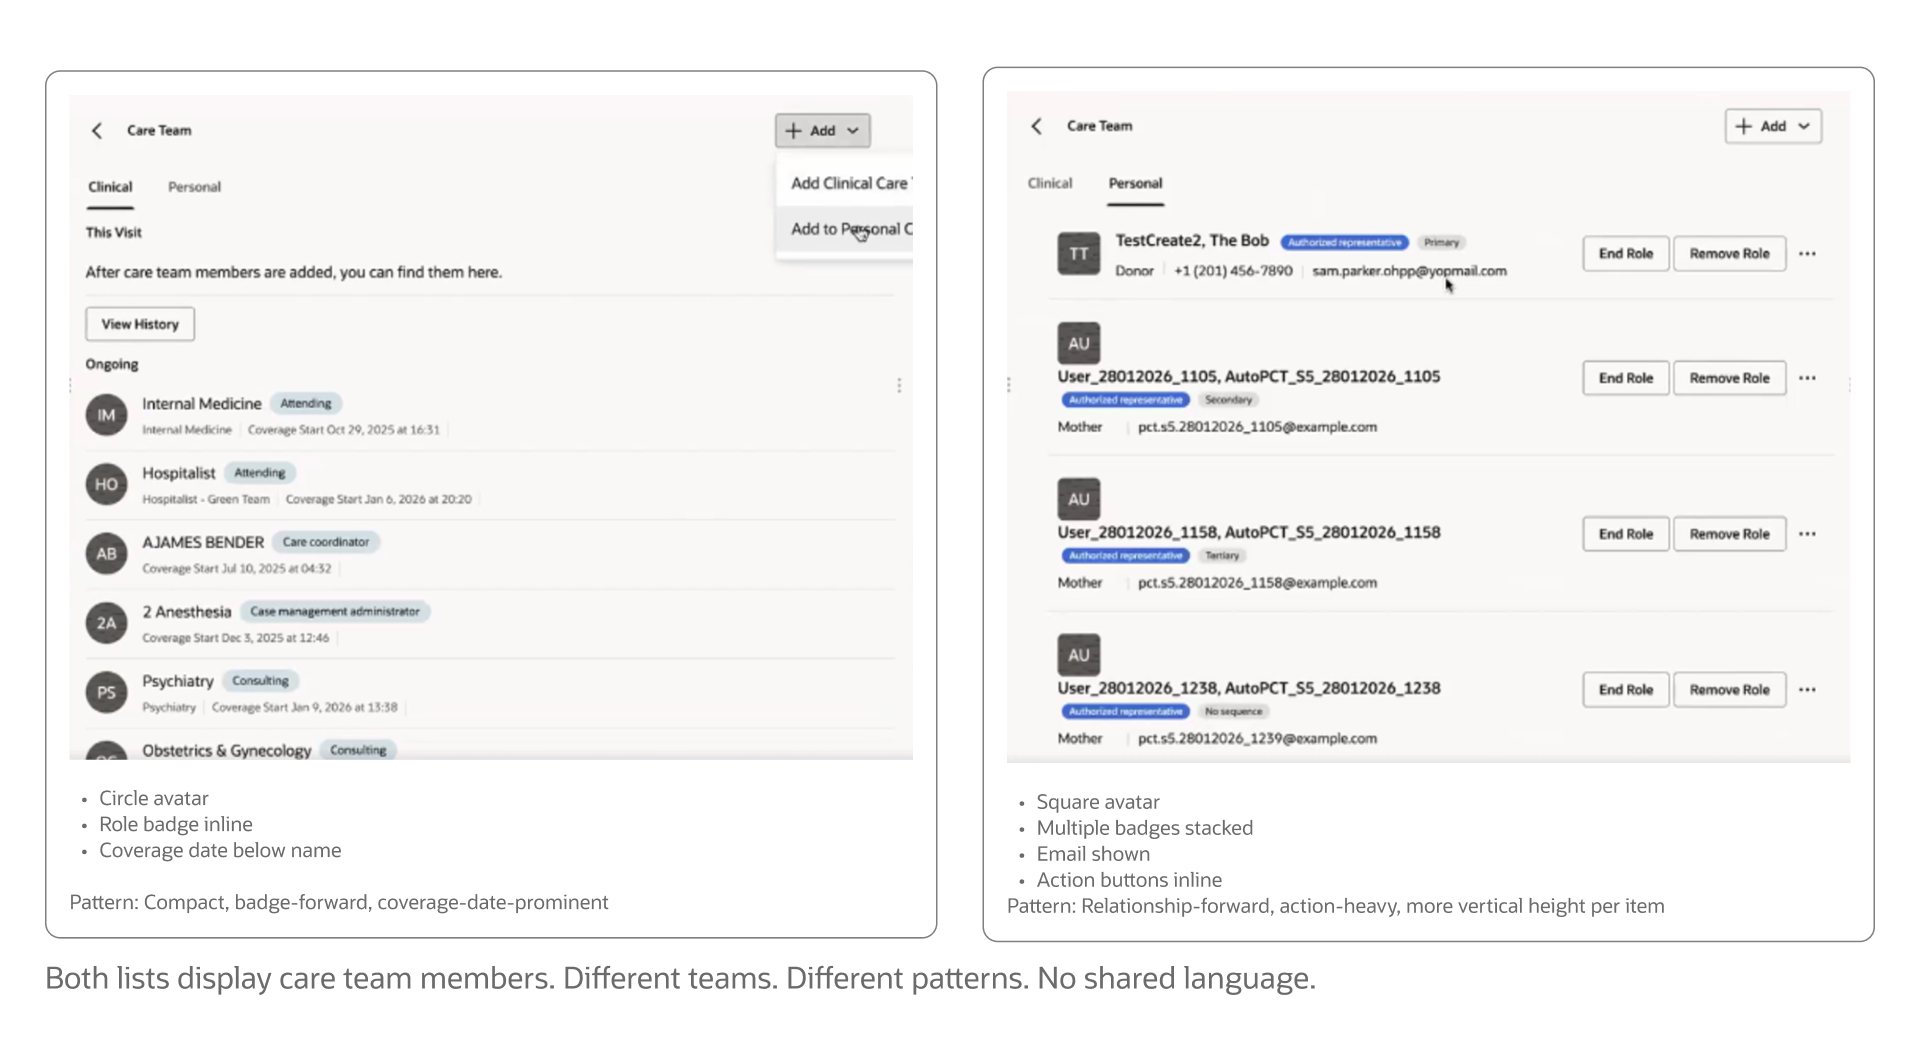
Product teams across Oracle Health: Providers, Specialties, Schedulers, Billing, Pharmacy, were all displaying lists and data in differing patterns.
Building the patient chart required moving fast: experiment, implement, validate, iterate.
Oracle Health needed to build a dedicated system, purpose-built for clinical workflows.
The intent was to build a clinical products need now, fold back into Redwood later.
I owned lists, cards, and tables, the primary data surface in every clinical workflow.
Collaborated across other principal designers and design directors to ensure system-wide consistency.
Direction was to built it fast but had no cross functional team assignments.
No development partners at the start.
I identified pilot teams, initiated relationships and earned participation.
Ran office hours and working session.
We looked at their designs and documentation together.
Mapped use cases to find where real alignment was possible.
Lists were the primary way information was being presented across all teams.
Lists were universal in surfacing data surface across all views.
Flexible enough to fit every use case.
Consistent enough to create coherence.
Gave every team a clear answer to "what about my edge case?"
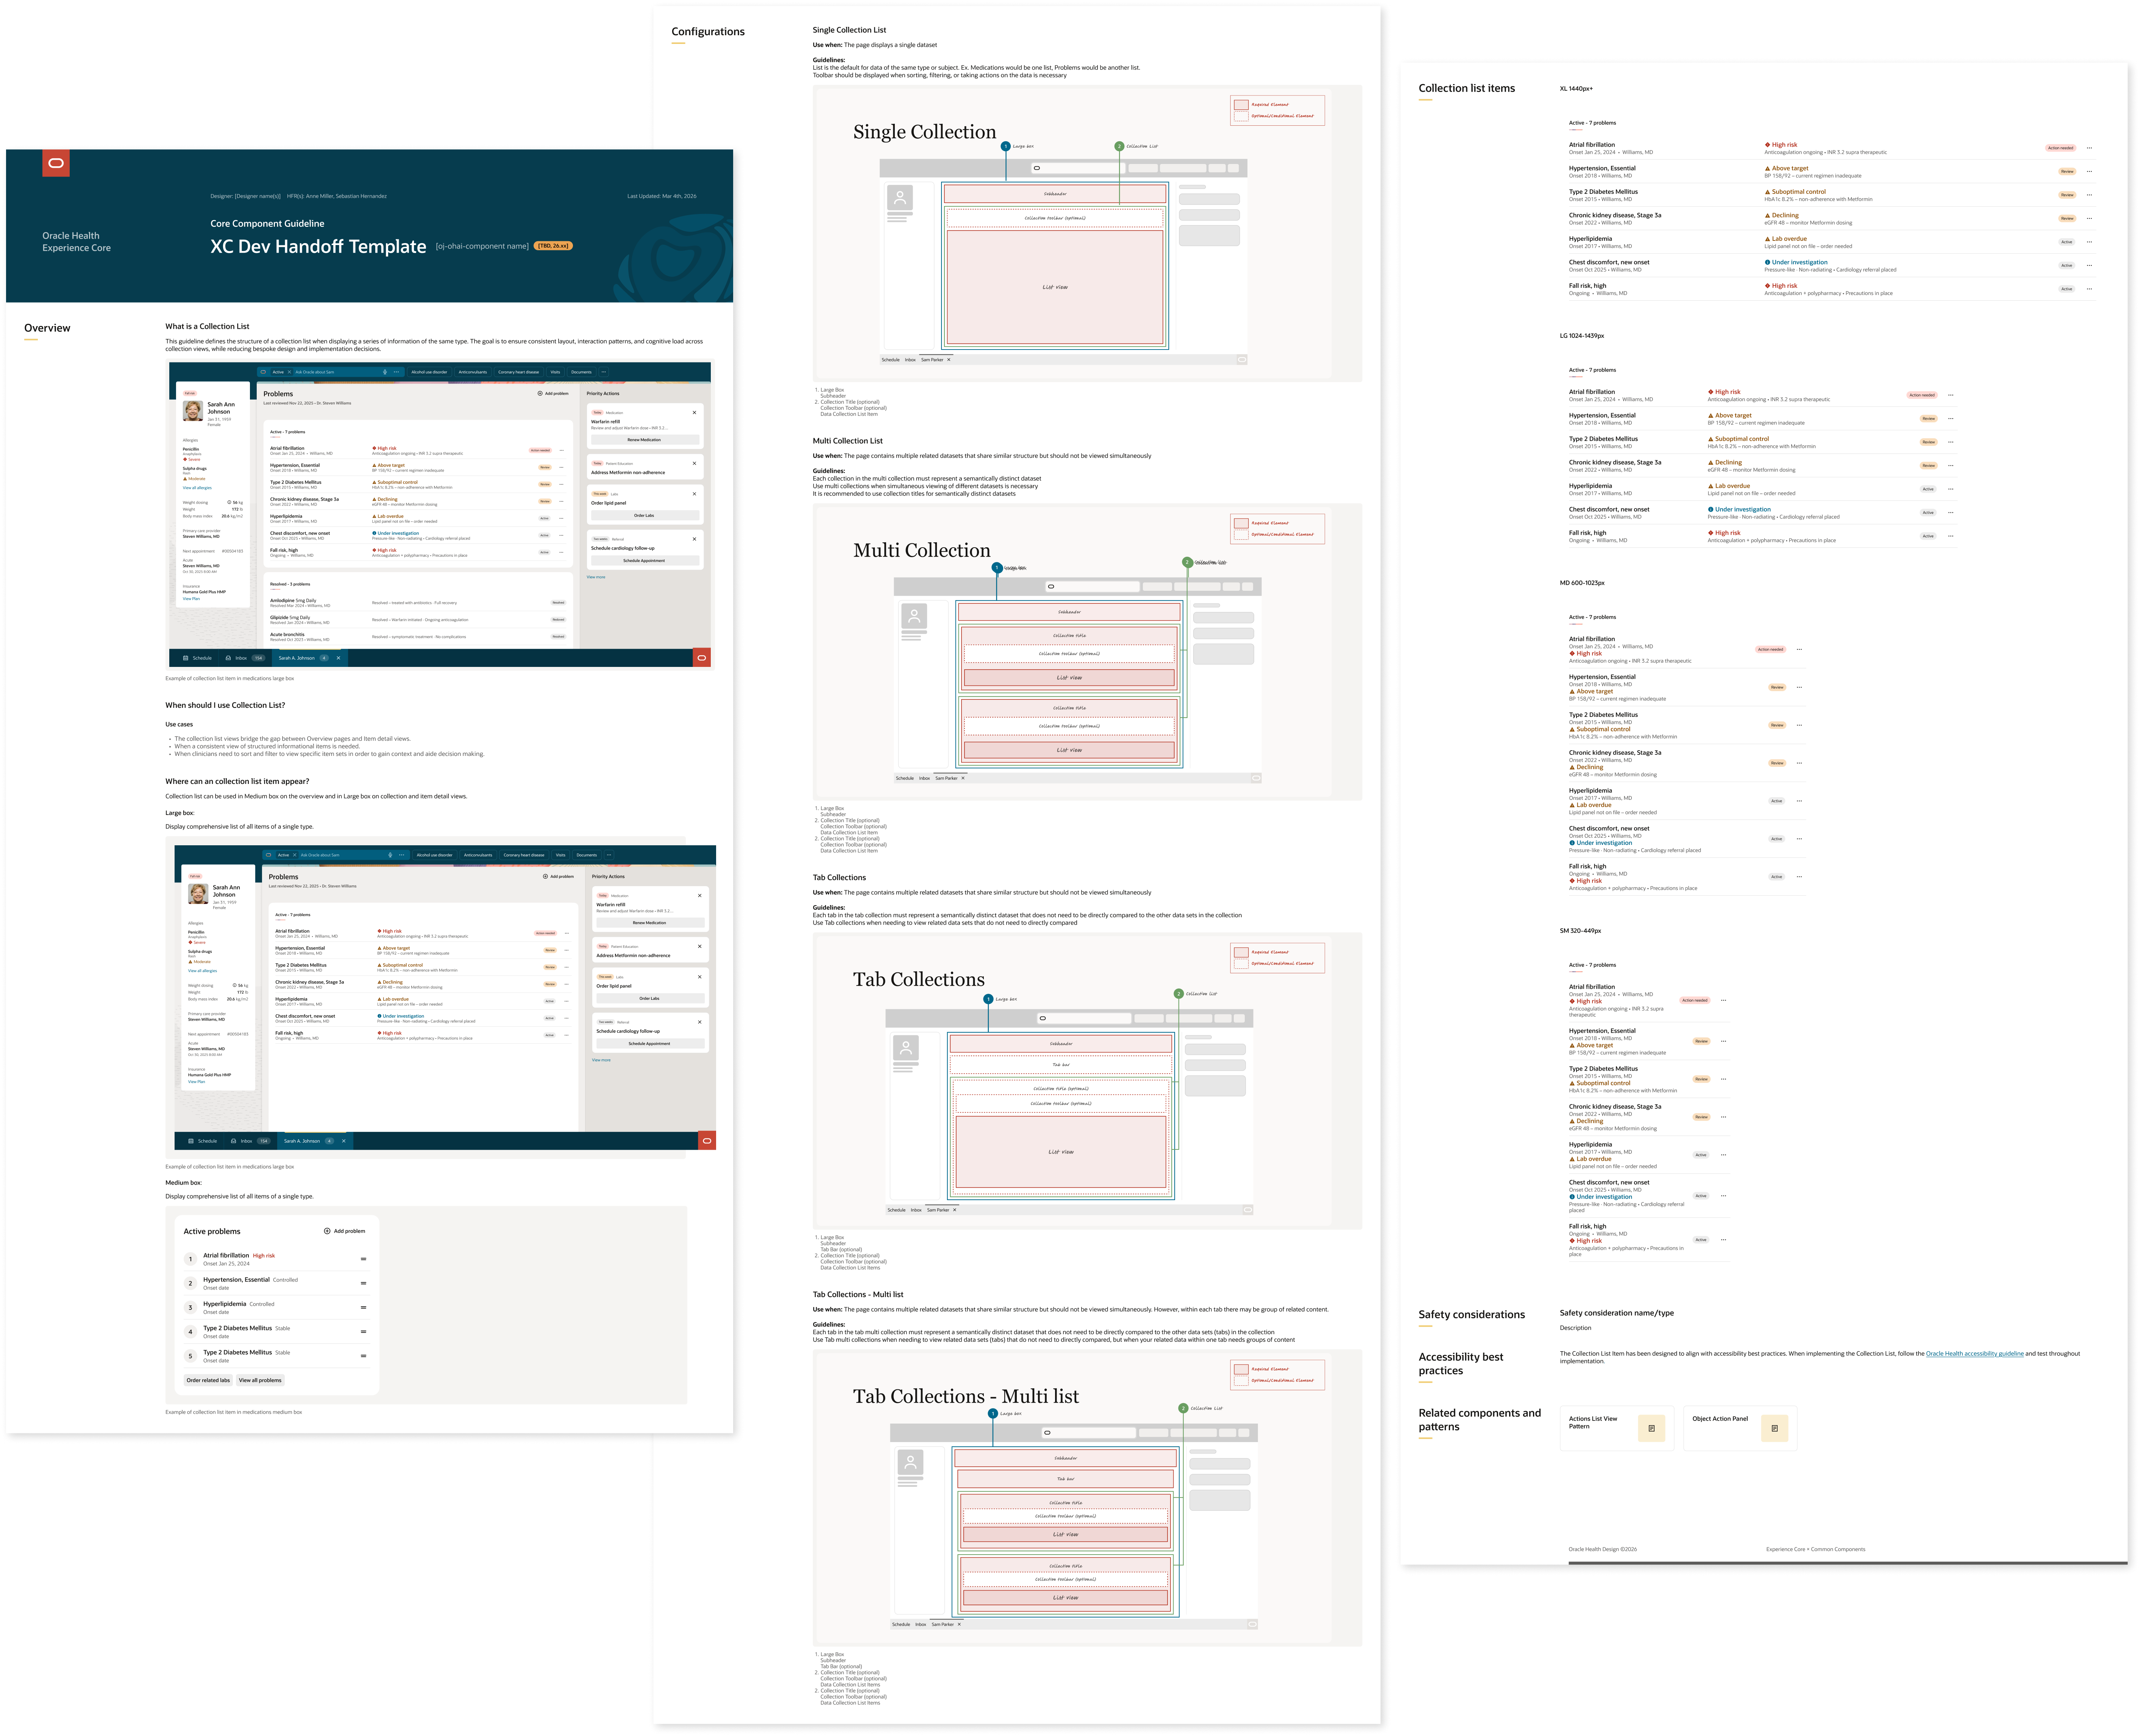
Audited designs across product teams, heard intent, understood real needs.
Mapped item data into categories: ex: What, Where, When, Why, How, and Status.
Defined the sockets of the list item with a flexible structure every team could populate.
Validated the new pattern back across teams for feedback.
Validated with clinical SMEs.
Got it built.
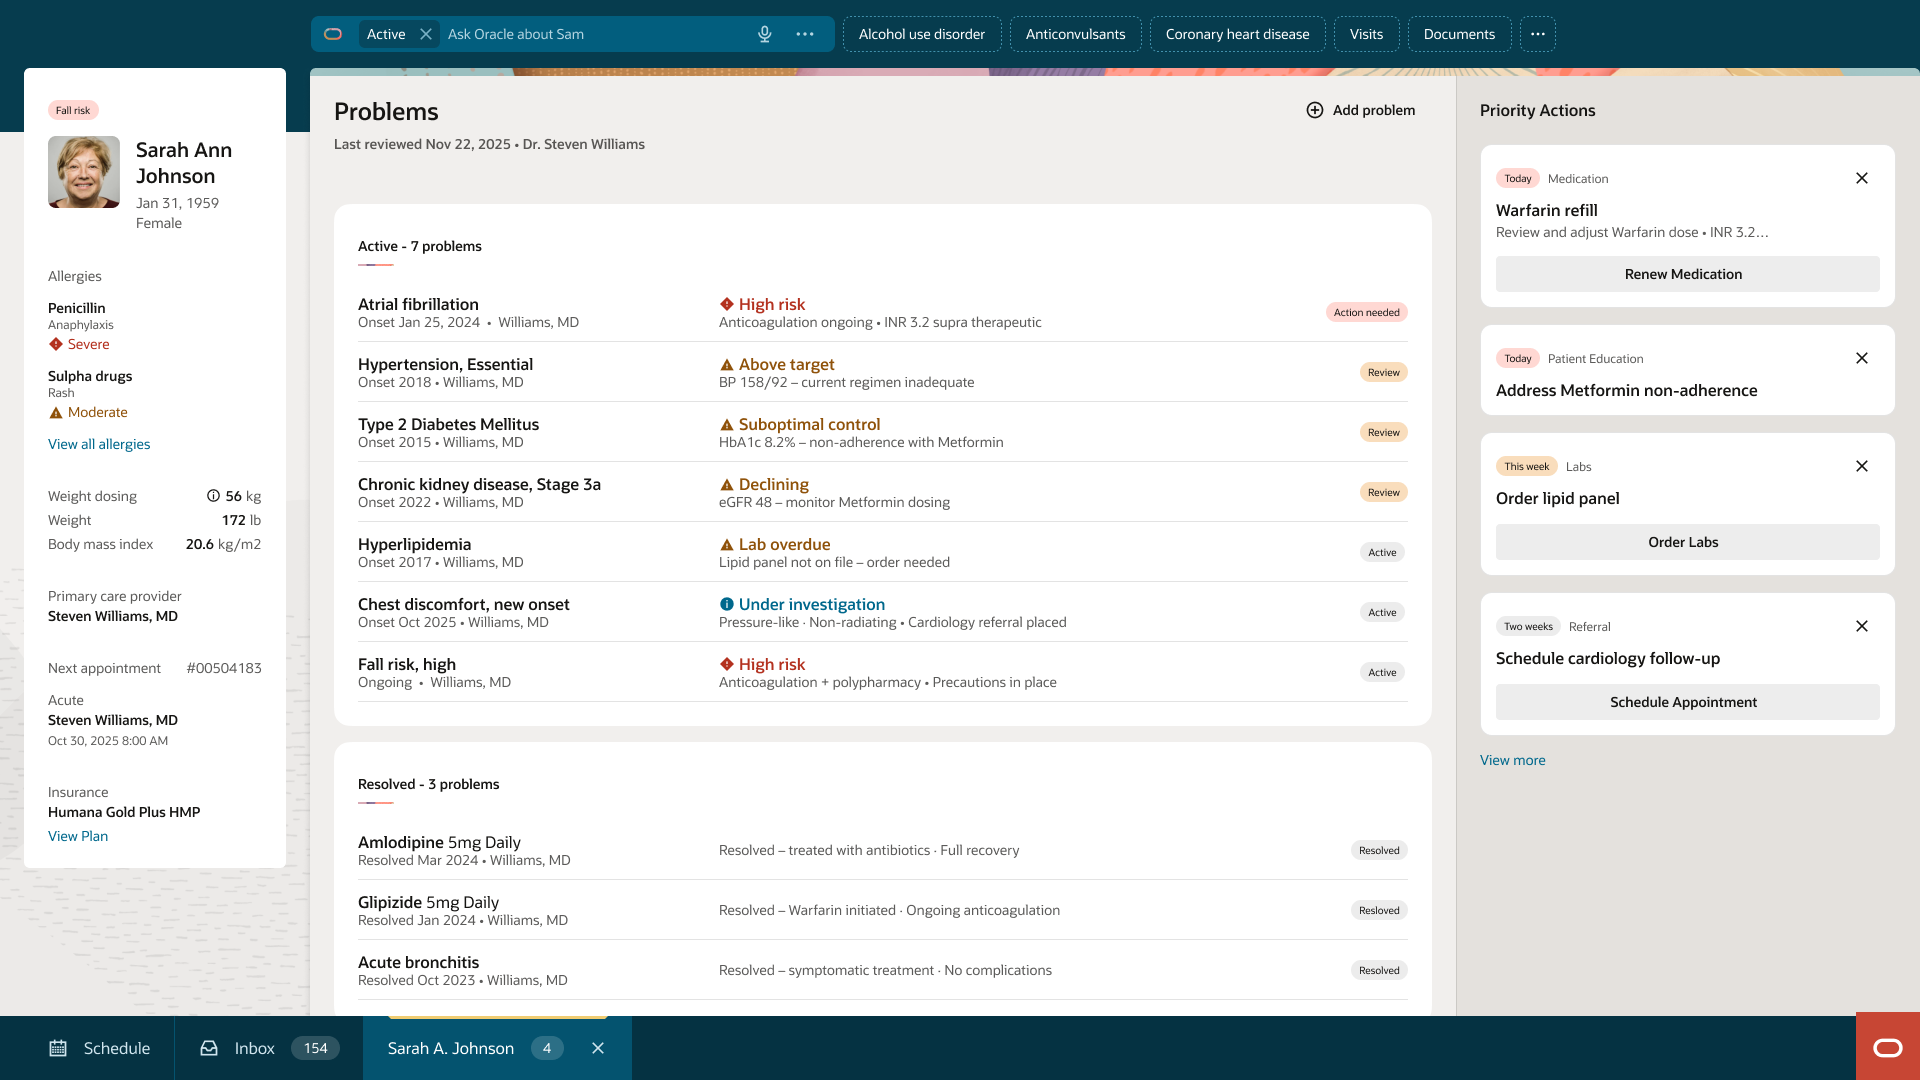
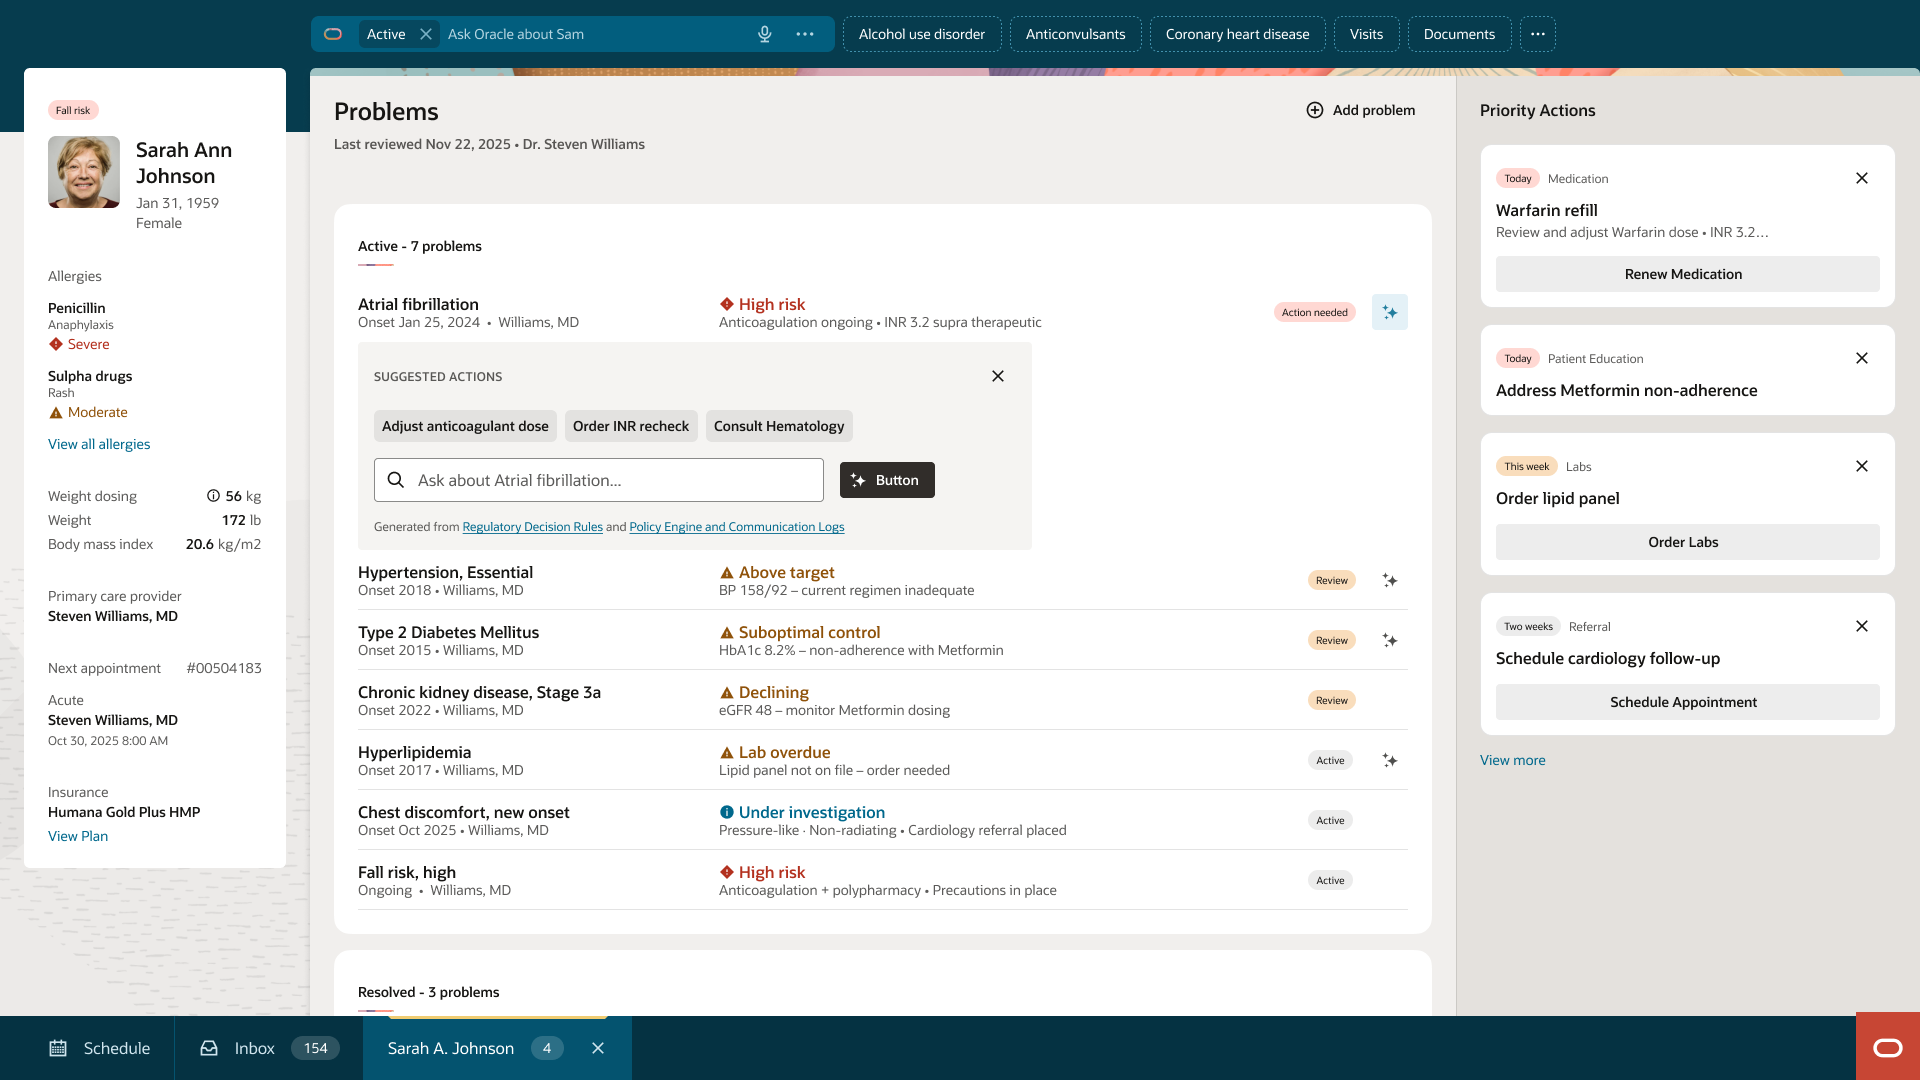
Every list item has a defined space for contextual insight.
Insights surface inline data relevant to that item. No drill-in required.
When AI detects a signal, it surfaces the insight and suggests an action.
The user clicks the AI icon they can take action. Prescribe medications, adjust a dose, or perform a freeform a command.
The decision happens in the list. The workflow never stops.
Ran office hours and working sessions with 5 pilot teams. Listened to specific needs to build a shared pattern.Fostered advocates not compliance.
Presented the contextual model lists and cards through formal design review processes. Led with clinical consistency and reduced design debt.
Trained design system champions within each product team. Adoption spread through designers and engineers who'd seen it work — not through a mandate from above.
All teams, ~12, feeding the Patient Chart adopted immediately.
Estimated twice that would begin adoption.
Adoption spread peer-to-peer through design system champions.
Shared ownership across all list types: Informational, Scheduling, Task, and Object.
I'm currently open to new design leadership roles. Whether you're building something ambitious or improving what you already have, I'd love to connect.
Get in touch